Skip to content

selected case study

OT-Sentinel

An explainable anomaly dashboard for industrial (OT) telemetry: a statistical detector decides, an LLM only explains the verdict, and a labelled rule-based fallback takes over when the LLM is unavailable. The detection method is evaluated offline on the public BATADAL attack benchmark, with a modest result reported as such.

Role fit

AI EngineerApplied AIIndustrial Systems

Quick technical review

The case study in four points.

Full methodology

Problem

An operator who gets an anomaly alert has to answer three questions fast: is it real, which signal is driving it, and what to check first. A raw score answers none of them, and an LLM allowed to decide for itself whether something is an attack can…

Read complete note

An operator who gets an anomaly alert has to answer three questions fast: is it real, which signal is driving it, and what to check first. A raw score answers none of them, and an LLM allowed to decide for itself whether something is an attack can invent a threat that is not there.

Architecture

Next.js App Router with React 19 and TypeScript. The live scorer is a weighted composite z-score over three simulated sensors whose constants are generated by a Python export script; a pytest fails if the TypeScript side or the model card table…

Read complete note

Next.js App Router with React 19 and TypeScript. The live scorer is a weighted composite z-score over three simulated sensors whose constants are generated by a Python export script; a pytest fails if the TypeScript side or the model card table drifts from that file. Genkit with Gemini 2.5 Flash turns the verdict into triage guidance under a 20-second timeout and per-client rate limits, and a deterministic rule-based fallback, labelled as such in the dialog, answers when the model does not.

Results

BATADAL: 43 signals, 14 attacks, one false-alarm budget for all detectors

Limitations & scope

Seven attacks per file make differences between detectors anecdotes, not significance. The evaluation measures the method on 43 signals, not the live dashboard's 3-signal scorer, whose telemetry is synthetic. One pressure signal drifted out of the…

Read complete note

Seven attacks per file make differences between detectors anecdotes, not significance. The evaluation measures the method on 43 signals, not the live dashboard's 3-signal scorer, whose telemetry is synthetic. One pressure signal drifted out of the 2014 range in about 18% of attack-free hours, and nothing was adjusted for it. There is no authentication and no real protocol adapter.

Summaries reuse the project’s documented evidence. Review the complete case study for evaluation boundaries.

Evidence-led visual review

Explore the actual work.

Actual project screenshots and repository figures are shown with source provenance.

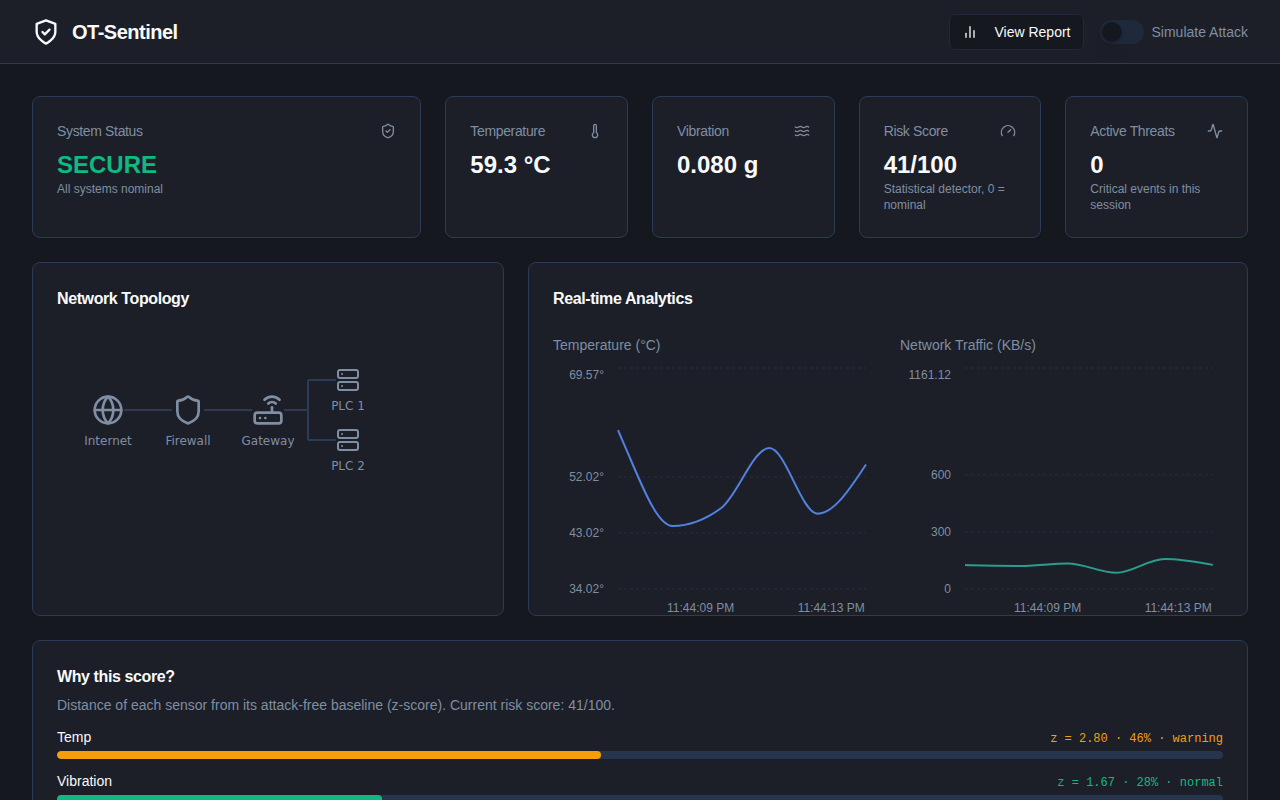
OT-Sentinel dashboard under normal synthetic telemetry

Application screenshot · synthetic telemetry

Published repository image; its interface may predate current development.

Open published source

BATADAL: 43 signals, 14 attacks, one false-alarm budget for all detectors

Max z-score PR-AUC 0.427 vs 0.195 chance on the 2017 test file; no temporal detector beats it

Every detector catches 7 of 7; false alarms alone would land in about 6.3

Metric flaw found in the first run, corrected and documented

Project proof

Verified external evidence

Last verified 2026-10-07

Problem and approach

Problem

An operator who gets an anomaly alert has to answer three questions fast: is it real, which signal is driving it, and what to check first. A raw score answers none of them, and an LLM allowed to decide for itself whether something is an attack can invent a threat that is not there.

Architecture

Next.js App Router with React 19 and TypeScript. The live scorer is a weighted composite z-score over three simulated sensors whose constants are generated by a Python export script; a pytest fails if the TypeScript side or the model card table drifts from that file. Genkit with Gemini 2.5 Flash turns the verdict into triage guidance under a 20-second timeout and per-client rate limits, and a deterministic rule-based fallback, labelled as such in the dialog, answers when the model does not.

Evaluation

Seven detectors (static limits, maximum absolute z-score, Isolation Forest, a supervised gradient-boosting reference, and three causal temporal detectors added in protocol v3: an EWMA of z-scores, a two-sided CUSUM and a 24-hour rolling residual) are compared on BATADAL, 43 hourly signals from a simulated water network with 14 attacks in two files. Each learns from attack-free 2014 data and is held to the same false-alarm budget of one alarm segment per attack-free day. On the headline 2017 test file (7 attacks, 407 attack hours) every detector catches all 7 attacks, which false alarms alone would nearly do; the maximum z-score has the best PR-AUC, 0.427 against a random-guess 0.195, with 54.9% precision while flagging 26.0% of attack hours. The supervised reference does not win.

Protocol v3: temporal detectors

A third protocol, committed before its first run, asked whether time-aware detectors with fixed textbook parameters beat the per-sample z-score. The rule, set in advance: a detector counts as better only if the 95% day-block bootstrap interval of its paired PR-AUC difference on the test file lies entirely above zero. None passes: the CUSUM (-0.377 to -0.042) and the rolling residual (-0.180 to -0.021) are worse, and the EWMA's interval (-0.088 to 0.041) includes zero; the EWMA is better on the 2016 file only, which is why the rule reads the test file. The same protocol checks the explanations: for the z-score, the three largest per-signal scores include a signal the attack description names in 58.5% of alarmed attack hours against an 18.3% chance level, but not under replay concealment.

What went wrong first

The first run showed the static-limit detector with zero false alarms and zero hours to detect: it was alarming all the time. The false-alarm budget counted alarm segments, and a permanent alarm is one segment. The alarm rule was corrected, two columns that expose degenerate detectors (false-alarm hour share and the chance baseline) were added, and the amendment is documented rather than hidden. The benchmark's own label column also proved unusable (-999 for most attack hours, no 0 labels), so ground truth is the published attack intervals.

What is not claimed

Seven attacks per file make differences between detectors anecdotes, not significance. The evaluation measures the method on 43 signals, not the live dashboard's 3-signal scorer, whose telemetry is synthetic. One pressure signal drifted out of the 2014 range in about 18% of attack-free hours, and nothing was adjusted for it. There is no authentication and no real protocol adapter.

Why it matters

A language model placed inside an operational workflow with guard rails around it: the detector owns the verdict, inputs are validated, the call is time-boxed and rate-limited, and the operator always gets guidance. The offline evaluation then tests the detection method on a public benchmark instead of asserting it.
Architecture and analysis

  • Keeps detection simple and auditable, shows why every alert fired, and uses the LLM only to explain.
  • Evaluates the detection method on a public attack benchmark under one false-alarm budget for every detector.
  • Reports a modest result and a corrected metric flaw instead of a flattering headline.

Testing and validation

  • BATADAL evaluation pipeline in analysis/, with every number in the README and case study generated from one results file
  • "Why this score?" panel with per-sensor z-scores, plus operator feedback (confirmed threat or false alarm)
  • Jest with coverage thresholds, Playwright E2E and pytest; CI with Docker build, CodeQL, npm audit, pip-audit and secret scanning
  • Security headers and CSP, rate limits, CSV formula-injection guard, and a threat model mapped to ATT&CK for ICS

Operational value

  • Compares seven detectors on BATADAL under the same false-alarm budget; on the 2017 test file the maximum z-score reaches PR-AUC 0.427 (95% interval 0.264 to 0.573) against a 0.195 random-guess baseline, and no temporal detector beats it under a rule fixed in advance.
  • Shows why "attacks caught" is uninformative there: every detector catches all 7, and false alarms alone would be expected in about 6.3 of them.
  • Explains each alert with per-sensor contributions and drafts triage with Gemini, falling back to labelled rule-based guidance on error, timeout or rate limit.
  • Fixed false CRITICAL alarms in the demo's normal mode (about 0.37% of samples, one every 4-5 minutes, down to about 0.002%), now pinned by a seeded test.
  • Released as v0.2.0 on 6 October 2026 and v0.3.0 on 7 October 2026 (health endpoint, leaner dependencies), with a changelog and Dependabot-managed dependencies on Node 24.

How to inspect

  • Start with the case study: the protocol, the per-attack tables and the amendment are all there.
  • Read the hour-level columns (precision, attack hours caught, PR-AUC against chance), not "attacks caught".
  • Treat the live dashboard as a demo on synthetic telemetry; the BATADAL result evaluates the method, not that scorer.
  • Pair it with the Visual QC RAG layer for the other measured LLM application in the portfolio.

Related case studies

All projects