Hiring teams
Evaluating for a role
Three evidence-led review paths for model validation, analytics engineering and AI applications, with direct access to CV and source repositories.
Evidence-led portfolio
 Personal brand
I build and evaluate machine-learning models for fraud analytics, financial forecasting, predictive maintenance, and visual quality control. I also develop LLM-based tools for information retrieval and engineering workflows. My case studies document the data sources, validation approach, results, and limitations.
Machine learning, analytics engineering and AI projects—with source code, evaluations and limitations.
10 selected projects · 16 source-linked cases · EN/TR
Choose your starting point
Go directly to role-specific technical evidence or scoped data services.
Hiring teams
Three evidence-led review paths for model validation, analytics engineering and AI applications, with direct access to CV and source repositories.
Clients and project teams
Excel/CSV cleaning and reconciliation, analytics reporting and repeatable Python/SQL data workflows. Inspect a sample delivery and discuss a scoped pilot.
This site presents portfolio case studies. Synthetic demonstrations are not represented as paid client engagements or real plant records.
30-second review
NEXUS / INTELLIGENCE ATLAS
From fraud analytics to computer vision: explore six source-linked case studies in a spatial, interactive 3D atlas. The visual experience is entirely optional.
Selected work
Start with four case studies. Explore by role or expand all 10 selected projects. Every visual is identified as illustration or evidence.
Showing 4 of 10 matching case studies
Case study 01
September 2026
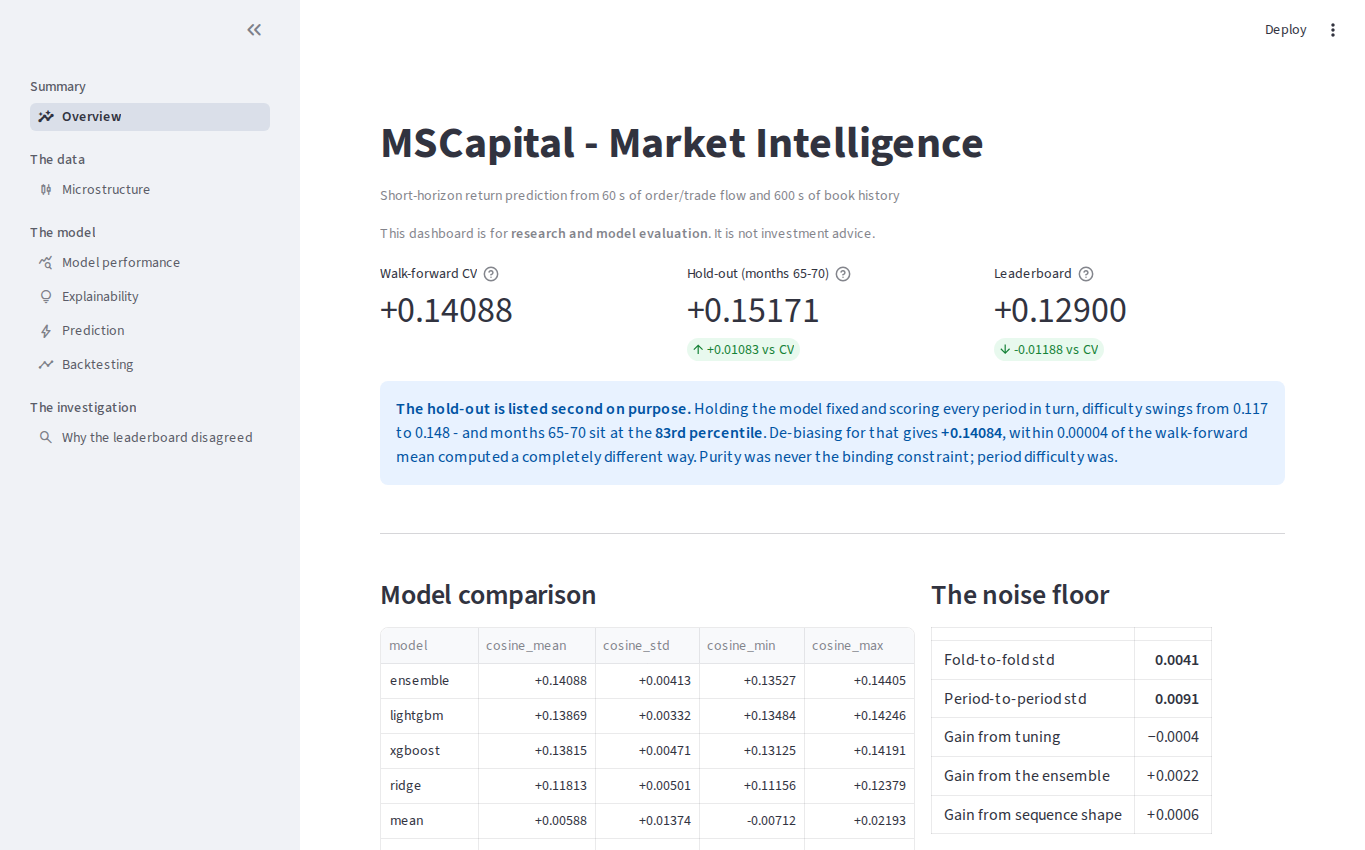
A production-shaped forecasting system over 804.5M rows of market microstructure, built on a 16 GB laptop, where the main result is an investigation into why the leaderboard disagreed with the hold-out.
Case study 02
May 2026
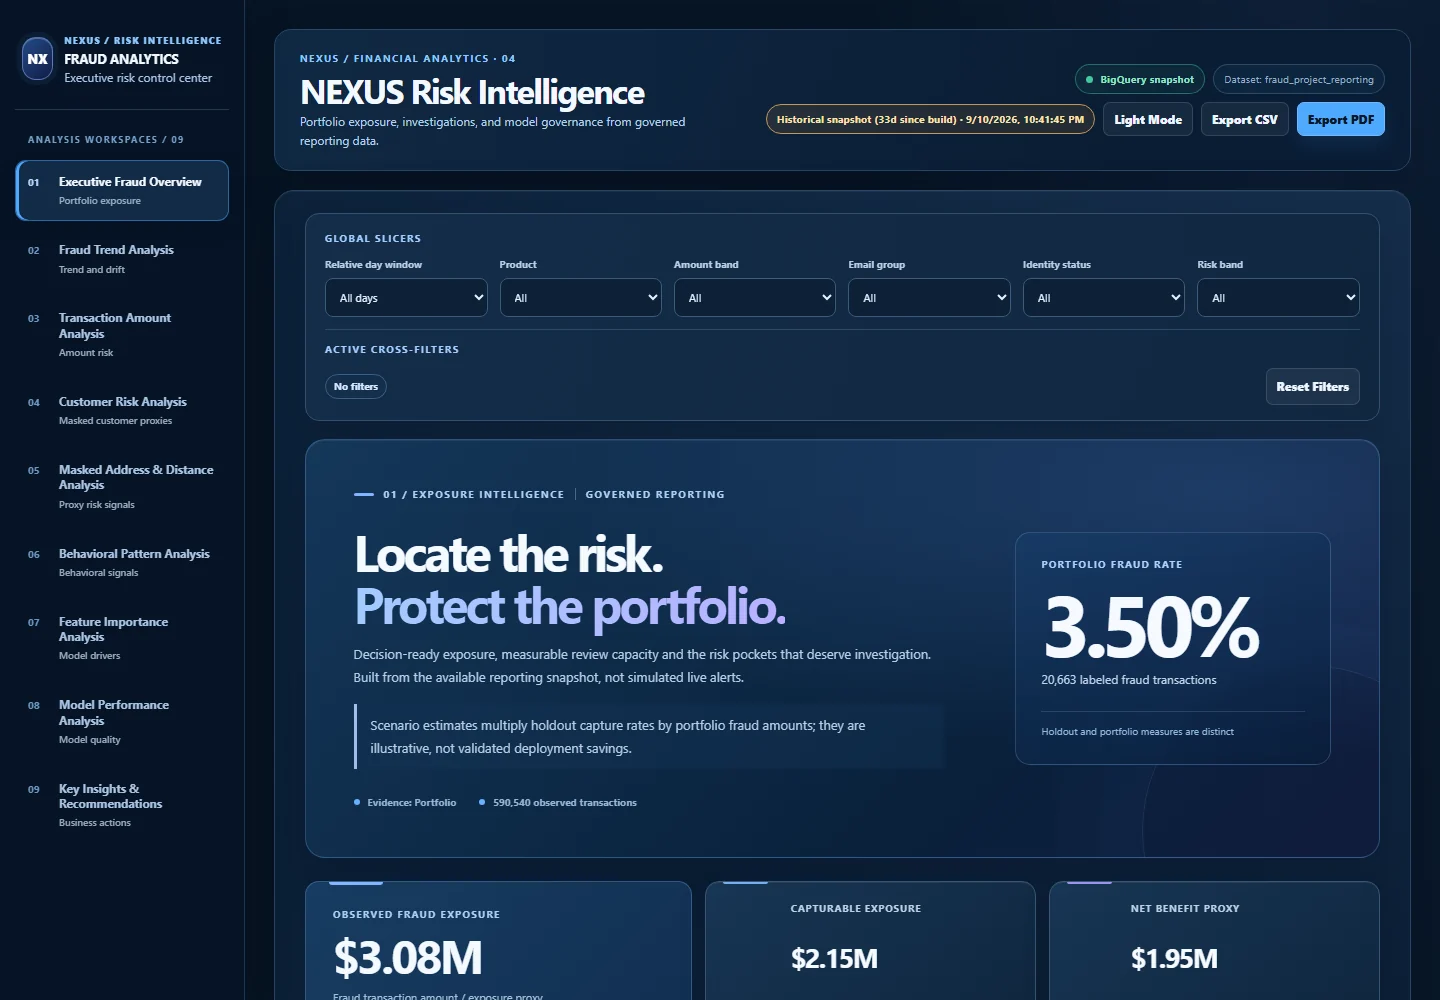
An end-to-end fraud analytics platform built on the IEEE-CIS dataset, combining BigQuery, dbt, LightGBM, FastAPI, and a live executive dashboard.
Case study 03
September - October 2026
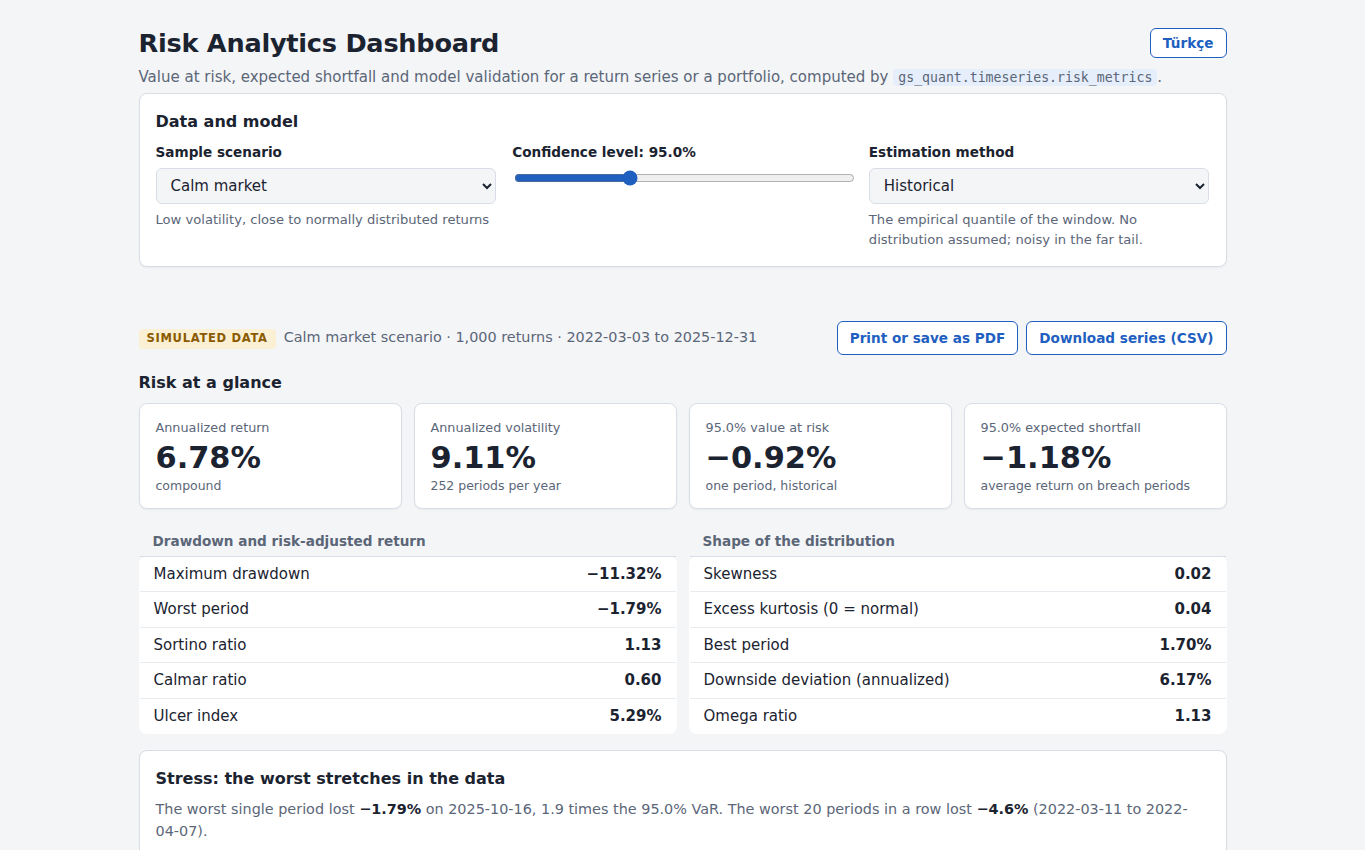
A value-at-risk and expected-shortfall application built on a fork of Goldman Sachs' open-source gs-quant library: it measures the risk of a series or a portfolio and then tests whether the VaR model deserves to be trusted, with every forecast judged on the return that followed it.
Published evidence
VaR backtested with Kupiec, Christoffersen and Basel traffic light
Case study 04
June–August 2026
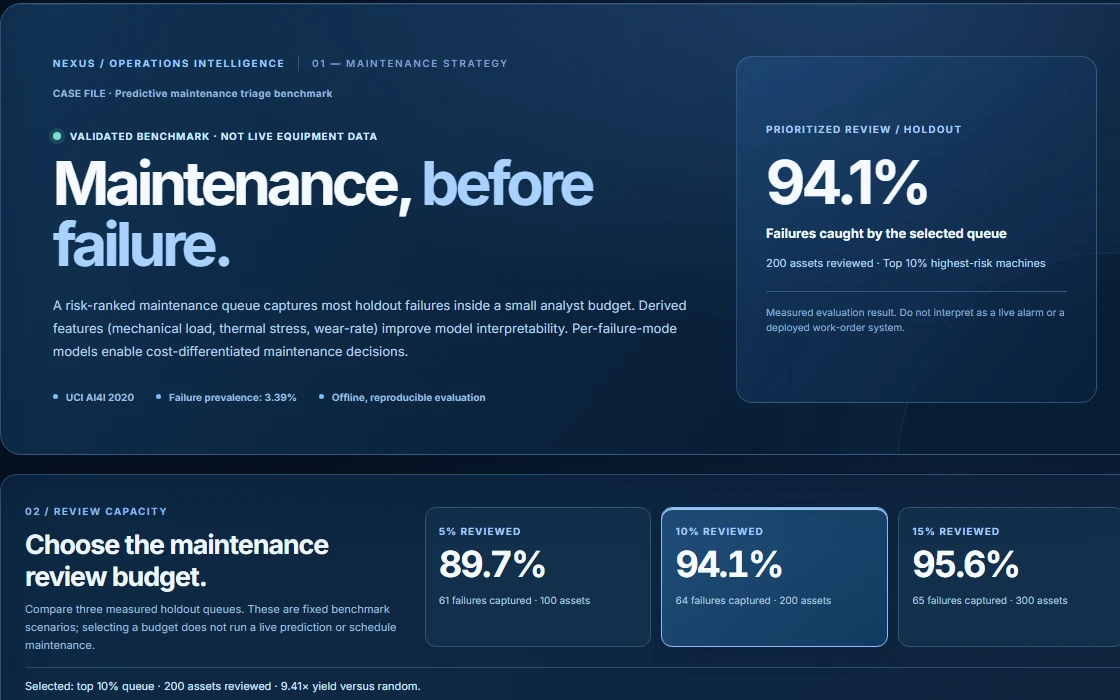
A predictive-maintenance analytics case study on 10,000 AI4I records, combining EDA, engineered sensor signals, evaluated failure-risk scoring, DuckDB SQL, and a ranked maintenance queue — plus a second, genuine RUL-regression case study on NASA C-MAPSS turbofan data.
6 more selected projects are available here. The complete 16-project library includes the archive and role-specific filters.
The throughline
Measured on held-out data. The dashed diagonal is random review; every point above it is inspection work the model saves.
| Project | Share reviewed | Share caught | Lift over random |
|---|---|---|---|
| Smart Factory | 5% | 89.7% | 17.9× |
| Smart Factory | 10% | 94.1% | 9.4× |
| Smart Factory | 15% | 95.6% | 6.4× |
| Visual QC | 10% | 45.5% | 4.5× |
| Visual QC | 15% | 50% | 3.3× |
| Visual QC | 20% | 81.8% | 4.1× |
| Fraud Risk | 9.4% | 69.8% | 7.5× |
| Fraud Risk | 12.8% | 76.5% | 6.0× |
| Fraud Risk | 18.1% | 82.9% | 4.6× |
| Fraud Risk | 22.2% | 86.2% | 3.9× |
| Fraud Risk | 27.9% | 89.4% | 3.2× |
| Fraud Risk | 36.2% | 92.5% | 2.6× |
| Fraud Risk | 49.4% | 95.7% | 1.9× |
Public demo directory
These are links to deployed interfaces, not uptime checks. Some services sleep when idle or may temporarily be unavailable. See the case study for the source and evaluation context.
590,540 transactions
Open dashboardPublic demo804.5M raw rows reduced to 292 features, 264 distinct
Open dashboardPublic demoVaR backtested with Kupiec, Christoffersen and Basel traffic light
Open dashboardPublic demo10,000 AI4I records
Open dashboardPublic demo1,800 NEU-CLS images across 6 classes
Open dashboardPublic demo3,662 fundus images; five-fold ensemble QWK 0.9091
Open dashboardFreelance solutions · delivery example
A small, fixed-scope Python and SQL-friendly workflow for BI and software agencies that need dependable data preparation and reporting support. This is a public, synthetic demonstration, not a client engagement.
Excel/CSV Reporting Automation
Clean and merge inconsistent files, quarantine invalid records, calculate agreed KPIs and hand off reusable Python code with validation tests. A live HTML dashboard shows the sample output.
Verified synthetic sample
200
Input rows
192
Valid rows
8
Flagged rows
9
Automated tests
Source row reconciliation passes. CI runs on Python 3.11 and 3.12.
01
Import
Two synthetic sources: sales CSV and customer Excel workbook.
02
Validate
Identify invalid values, conflicting orders and unmatched customers.
03
Reconcile
Check that accepted and excluded records account for every source row.
04
Deliver
Export clean data, quality logs, KPI tables and a standalone report.
The hosted page is a static report; it does not accept client file uploads. Scope, fees, confidentiality and delivery dates are agreed after reviewing anonymized sample data.
Discuss a scoped pilotRole-based review routes
Each route uses the same verified project library but changes the recommended review order.
Evaluated machine-learning workflows: validation design, calibration, ranking quality, and the review queues a model actually feeds.
LLM applications with measured behaviour: an embedding-RAG assistant benchmarked against a keyword baseline and a no-retrieval control, an anomaly-triage dashboard whose detector is evaluated on a public attack benchmark and whose LLM only explains, plus shipped Gemini and Genkit apps for retrieval-grounded answers and multimodal diagram parsing.
The tested data layer under the models: governed dbt/BigQuery pipelines, data quality testing, KPI design, and reporting surfaces.
Capability preview
Machine learning, deep learning and LLM work, validation and calibration discipline, statistical analysis, and the warehouse and BI layer underneath are connected through the same requirement: every number a reviewer reads can be traced back to how it was measured.