Problem
Website and order data need to be modeled into a reporting layer that explains traffic quality, conversion behavior, and channel-level commercial performance.
selected case study
A tested analytics-engineering and BI portfolio spanning dbt/BigQuery marts, DuckDB CI, Power BI, DAX, Olist analysis, cohort/RFM SQL, and statistical testing.
Quick technical review
Website and order data need to be modeled into a reporting layer that explains traffic quality, conversion behavior, and channel-level commercial performance.
A three-layer dbt architecture produces four BI-ready marts in BigQuery. Every model is written cross-adapter through Jinja dispatch, so the same code and 57 of its tests reproduce on DuckDB with no warehouse credentials.
10 dbt models + 4 BI-ready marts
The public Olist analysis adds EDA, cohort retention, RFM segmentation, delivery analysis, and T-test, ANOVA, and Chi-square workflows.
Summaries reuse the project’s documented evidence. Review the complete case study for evaluation boundaries.
Evidence-led visual review
Actual project screenshots and repository figures are shown with source provenance.
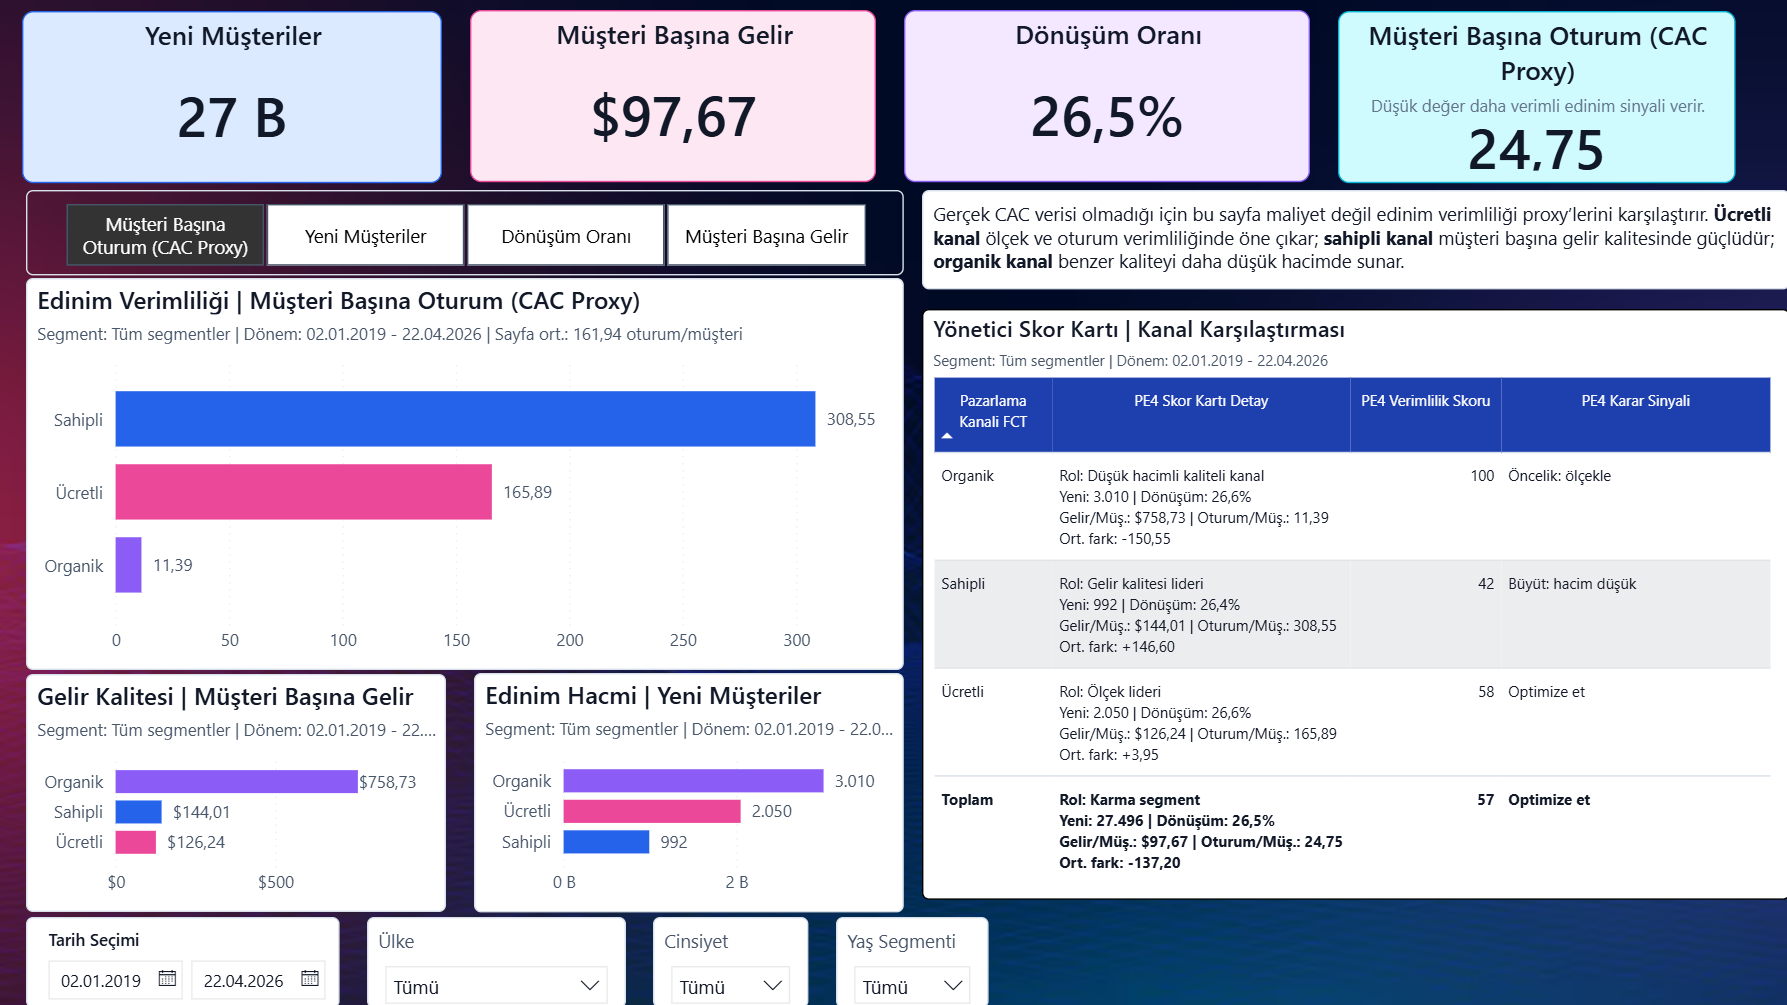
Power BI screenshot
Published repository image; its interface may predate current development.
Open published source10 dbt models + 4 BI-ready marts
73 dbt tests + 57 DuckDB CI tests
Chi-square p 0.15 over 680,450 sessions
30 documented DAX measures
Approximately 99K Olist orders analyzed
Project proof
Last verified 2026-10-05
Problem and approach
Website and order data need to be modeled into a reporting layer that explains traffic quality, conversion behavior, and channel-level commercial performance.
A three-layer dbt architecture produces four BI-ready marts in BigQuery. Every model is written cross-adapter through Jinja dispatch, so the same code and 57 of its tests reproduce on DuckDB with no warehouse credentials.
The channel ranking is tested rather than assumed. A chi-square test over 680,450 sessions does not reject equal conversion across traffic sources, so the repository reports that the ranking rests on revenue and volume rather than recommending a channel to scale.
Direct identifiers stop at the staging layer, which sits behind its own access control. The user dimension drops names, raw email, and street address, reduces email to a hash plus its domain, and rounds coordinates to roughly 11 km. A September 2026 review found that an intermediate view was still joining user attributes onto every event row, pulling names and email addresses into a view nothing downstream read; that join was removed.
The public Olist analysis adds EDA, cohort retention, RFM segmentation, delivery analysis, and T-test, ANOVA, and Chi-square workflows.
The repository demonstrates how modeled data, BI delivery, analytical SQL, and statistical testing can remain distinct but connected proof surfaces.
Architecture and analysis
Testing and validation
Operational value
How to inspect