Problem
The business question is where fraud concentrates and how an operations team should prioritize limited review capacity.
selected case study
An end-to-end fraud analytics platform built on the IEEE-CIS dataset, combining BigQuery, dbt, LightGBM, FastAPI, and a live executive dashboard.
Quick technical review
The business question is where fraud concentrates and how an operations team should prioritize limited review capacity.
The pipeline starts from Kaggle CSV files, moves through DuckDB and BigQuery, then uses dbt marts and a FastAPI reporting layer to publish the executive dashboard.
590,540 transactions
Categorical columns are passed to LightGBM as integer codes numbered by order of first appearance, so the trees split on an arbitrary category ordering; the repository documents this as a known limitation that has not been measured yet, and…
Categorical columns are passed to LightGBM as integer codes numbered by order of first appearance, so the trees split on an arbitrary category ordering; the repository documents this as a known limitation that has not been measured yet, and switching to native categoricals would change every reported metric. TransactionDT is an elapsed-time offset, not a calendar timestamp. The net-benefit figure rests on stated assumptions (for example a $5.00 review cost per false positive), so it compares thresholds under those assumptions rather than predicting savings.
Summaries reuse the project’s documented evidence. Review the complete case study for evaluation boundaries.
Evidence-led visual review
Actual project screenshots and repository figures are shown with source provenance.
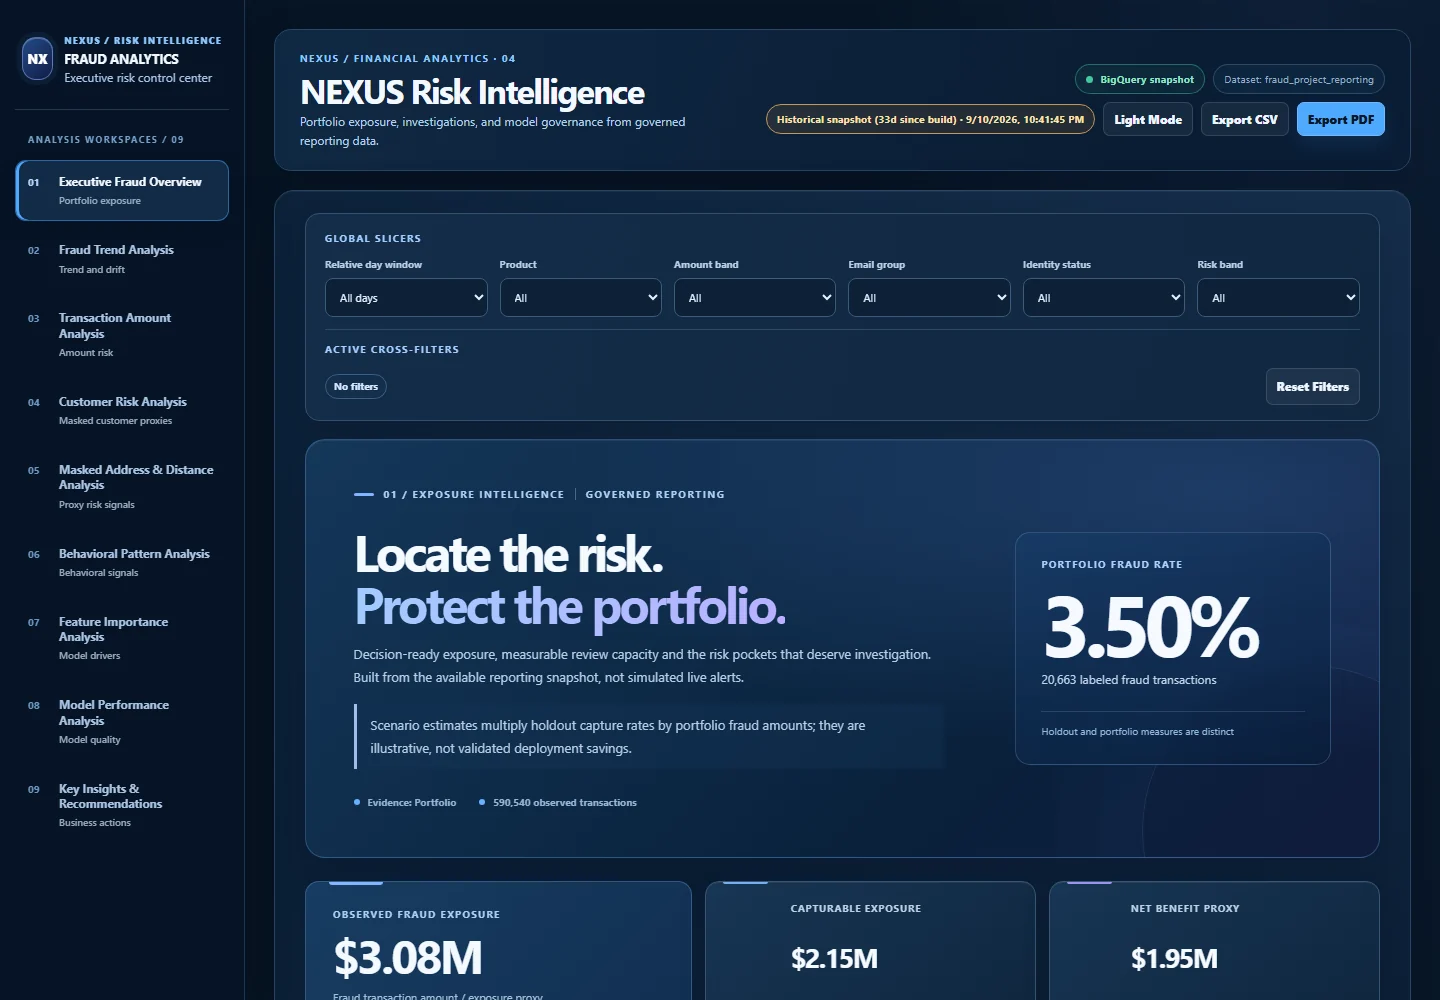
Dated demo screenshot
Public demonstration screenshot dated 2026-10-14; does not establish that the demo is currently online.
Open published source590,540 transactions
126 dbt data tests + 23 Python contract tests
0.9134 ROC-AUC / 0.5354 average precision
Top 5% captures 58.32% of fraud
High band 30.34% on holdout vs 44.59% in-sample
Score uncalibrated by design: 5.22x mean overprediction
Project proof
Last verified 2026-10-05
Problem and approach
The business question is where fraud concentrates and how an operations team should prioritize limited review capacity.
The pipeline starts from Kaggle CSV files, moves through DuckDB and BigQuery, then uses dbt marts and a FastAPI reporting layer to publish the executive dashboard.
A LightGBM classifier is validated on a time-based holdout and used as a review-prioritization layer rather than an automated decline engine.
Band quality is reported on the 118,108-transaction holdout rather than the split the model was fitted on. The model is fitted on the first 80% of the time axis and then scores every row, so that split is four fifths in-sample and flatters each band: the High band reads 44.59% there against 30.34% on transactions held out of training. The dashboard publishes the gap band by band rather than resolving it in favour of the model. The pipeline is also deterministic by measurement rather than assertion: retraining it on 1 September 2026 reproduced 23 of the 24 model-registry fields byte for byte, with only the training date moving.
The score is a rank, not a probability, and the project measures that rather than assuming it. Balanced class weights upweight the 3.5% positive class roughly 28 to 1, which buys the ranking and costs the probability scale: on the holdout the mean score is 17.96% against a 3.44% observed fraud rate, a 5.22x overprediction, and the Brier score of 0.0636 loses to the 0.0332 a constant base-rate forecast achieves. Every downstream use is rank-based, so none of it is affected, but the reliability curve is published so a reader can check the limitation instead of trusting it.
A September 2026 review found and fixed four measurement defects. The review queue folded the label of the transaction under review into its own entity fraud history. Two-dimension filters read segment rates off the risk-ranked queue and reported a 100% fraud rate. A flat $120 per fraud label stood in for observed fraud amount in six places. The net-benefit figure rested on two undisclosed constants that priced caught and missed fraud on different scales. Python contract tests now pin the corrected behaviour (the suite has 23 Python contract tests).
Categorical columns are passed to LightGBM as integer codes numbered by order of first appearance, so the trees split on an arbitrary category ordering; the repository documents this as a known limitation that has not been measured yet, and switching to native categoricals would change every reported metric. TransactionDT is an elapsed-time offset, not a calendar timestamp. The net-benefit figure rests on stated assumptions (for example a $5.00 review cost per false positive), so it compares thresholds under those assumptions rather than predicting savings.
Reporting payloads are precomputed into committed snapshots and served from disk, so the dashboard answers in roughly 0.4 seconds and makes no warehouse call at request time.
The project connects analytics engineering, ML evaluation, and review-queue design in one portfolio surface instead of isolating them across separate repos.
Architecture and analysis
Testing and validation
Operational value
How to inspect