Problem
Predict a short-horizon return for each of 1.26M anonymous market windows (60 seconds of order and trade history, 600 seconds of market snapshots), scored by cosine similarity across the whole test set. There is no symbol column, so no cross-instrument history exists and every sample has to be self-contained.
Architecture
Feather files are converted by a column-group projector that keeps peak memory at 7.92 GB instead of the 11.53 GB a single read needs, loaded into BigQuery, aggregated into 292 features per sample, then trained locally. Serving is a FastAPI service over an artefact that loads without the training package, and the presentation layer is a Streamlit dashboard that runs from committed results with no pipeline behind it.
Validation
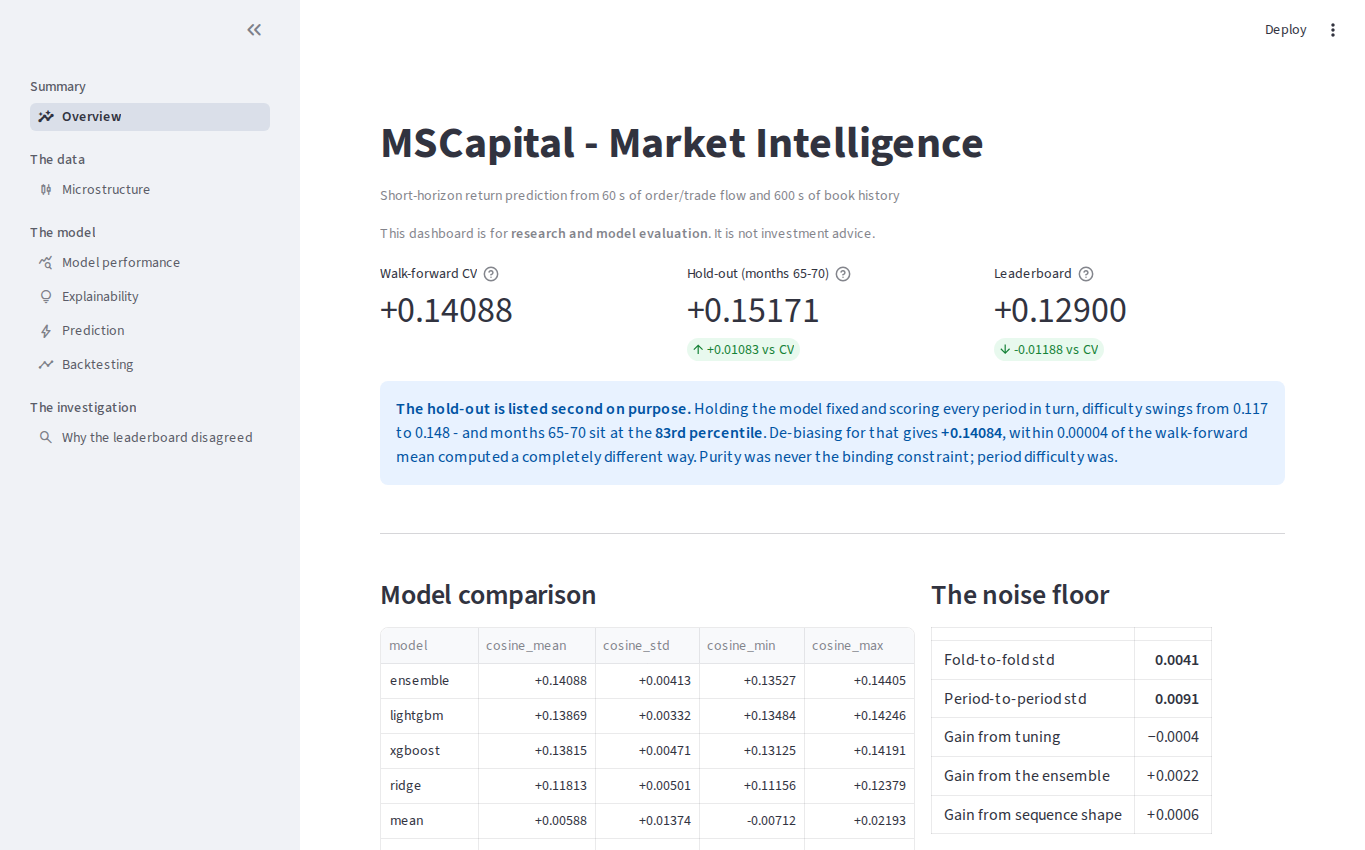
Walk-forward with expanding windows and a one-month embargo, because consecutive samples can share overlapping 60-second windows and a random split would leak. The ensemble averages +0.14088 cosine across five folds with a 0.0041 fold-to-fold standard deviation, and months 65-70 were held out untouched for a single final read of +0.15171.
The investigation
A falsifiable forecast was recorded before submitting and it was wrong: predicted 0.143, graded 0.128. Six hypotheses were then tested without spending another submission. One is confirmed - the hold-out sits at the 83rd percentile of period difficulty, and de-biasing for that gives +0.14084, within 0.00004 of the walk-forward mean computed a completely different way. One is real but smaller than forecast: the spread-regime mix, about 14% of the gap. Four are falsified, including the two most promising. The remaining gap is documented rather than resolved in the project’s favour.
Measurement discipline
Five recorded forecasts, five overshoots, every one in the same direction - which points at one cause rather than five mistakes. The rule that survives is that an internal gain below the fold-to-fold noise is evidence about which model to prefer, never a quantity that will reach a leaderboard. Three post-hoc corrections to the prediction vector were also measured and rejected: the best of them is worth +0.0022 fitted in place and roughly zero once its one parameter is chosen out of sample.
What is not claimed
The sequence-order hypothesis is stated at the width its experiment supports. Eighteen hand-built path statistics were tested and bought +0.0006, but the novel ones score 0.0057 standing alone where a constant-mean predictor scores 0.0059, so the summary carries almost nothing and the test cannot separate a signal-free path from a poor digest of it. A learned sequence model was then tried (v1.1.0): it scores 0.077 on its own, but blending it into the tabular model was not shown to help (paired gain -0.0009, 95% CI -0.0104 to +0.0086 over eight held-out months), so the hypothesis is neither confirmed nor ruled out at that width.
After the first release
Four further experiments, each with its decision rule written before the run and scored as a paired difference against the model it was meant to improve, none shown to help: a learned sequence model (the CNN alone scores 0.077, the blend gains -0.0009), a regime estimated from the feature space (-0.0010, an interval narrow enough to rule out a gain above about +0.0002), four extra ensemble members (+0.0017, with a slightly lower pooled cosine) and dropping 28 near-duplicate features (-0.0005). Along the way it was found that sample_id is chronological in train only at the scale of months and carries no order in the test set, so any feature built from neighbouring samples can be computed in train and not at scoring time. The full-data build also ran out of memory in the Ridge step on a 16 GB machine; Ridge now fits in chunks with identical predictions. The shipped ensemble scored 0.129 on the public leaderboard, unchanged, and the model files are public on Hugging Face.
Delivery
A suite of 533 tests, none of which needs live BigQuery or downloaded data (CatBoost and PyTorch tests skip when those packages are absent). Four CI jobs on every push: lint, typecheck and tests; a render of every dashboard page against the runtime dependencies alone; a Docker build with a smoke test of the slim API image; and an end-to-end run that trains the demo model and drives the API image over HTTP. The serving image is 777 MB against 3.48 GB for a single-image version. A synthetic-data demo reproduces the whole pipeline in about 15 seconds with no credentials.
Why it matters
The competition score sits below the field median, and the project says so on its front page. What it demonstrates instead is the part that transfers: recording forecasts before the answer, measuring rather than arguing, and reporting the result when the measurement contradicts the hope.