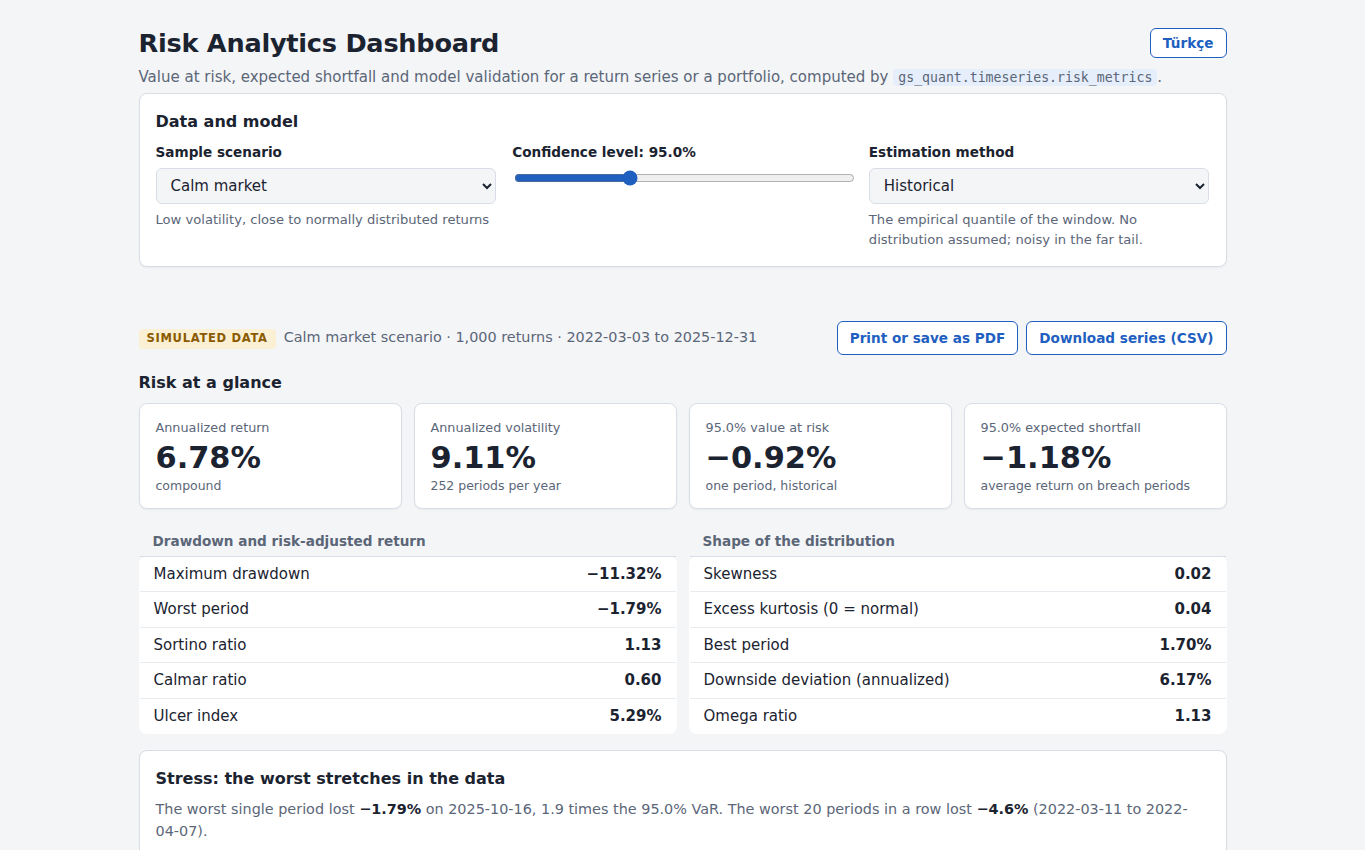
Problem
A VaR figure is only as good as the model behind it, and a model fitted to a long trailing window can look fine on average while being late every time the market changes. A risk number needs to come with the test of whether it has been right.
Architecture
A risk_metrics module inside the library (historical, parametric and Cornish-Fisher VaR, expected shortfall, drawdown, Sortino, Calmar, Omega, tracking error, information ratio, and the backtests) is used by a Starlette application with Pydantic-validated requests and SQLite storage for saved analyses and named portfolios, and by four analytics tools added to the library's MCP server so an LLM agent can call the same calculations. Daily prices come from Yahoo Finance by symbol, converted to one currency at the daily exchange rate, with the last copy used and dated when the provider is down.
Validation
Each VaR forecast is made from the previous window only and compared with the return that followed. The Kupiec frequency test, the Christoffersen independence and conditional coverage tests and the Basel traffic light turn the breaches into a verdict. A filtered (EWMA) estimate is backtested over the same periods as the rolling window, and the square-root-of-time rule for multi-period figures is itself checked over non-overlapping stretches, because overlapping ones break the independence the Kupiec test needs.
What the checks show
On the simulated Regime shift sample (1,000 periods, a calm market that turns turbulent) the 250-period rolling 95% VaR is breached 63 times against 37.5 expected, the EWMA estimate 41 times. The square-root rule is rejected by its own check, 8 breaches in 75 stretches against 3.75 expected, and a filtered historical simulation gives a 10-period 95% VaR of 12.0% where the rule gives 4.9%. These are properties of a simulated sample chosen to show the failure, not results on a real book.
Portfolio and scenarios
Portfolios of two to ten assets at constant weights, with Euler allocations of volatility and expected shortfall that add up exactly to 100%, the diversification ratio and the correlation matrix. Stress windows show the worst 1, 5 and 20 consecutive periods that actually occurred; what-if scenarios apply shocks of the user's own and are deliberately first-order, with no assumed betas or correlations. A benchmark adds beta, tracking error, the information ratio, up and down capture ratios and a rolling beta.
Delivery
Two releases (0.1.0 and 0.1.1) were published by a release workflow that runs the CI checks, builds the image, starts it once to check the version it reports, pushes it to ghcr.io and creates the GitHub release from the changelog; the image is public and a tagged release also installs with pip straight from the repository. The application refuses to listen beyond localhost without an API token, and applies a request-rate limit and a lockout after repeated wrong tokens. CI runs ruff, the test suite across Python versions, a Playwright test that drives the application in a real browser with axe-core accessibility checks, and a Docker job that checks the token refusal and scans the image. Saved analyses export to a stand-alone HTML report, an Excel workbook whose figures stay numbers and whose text cannot become a formula, and a print stylesheet for PDF.
What is not claimed
Daily closes only, no intraday or real-time prices. The demo runs on simulated GARCH(1,1) data with Student-t innovations, precomputed by the Python code. The deployment files have not been run end to end, and the README says so. The upstream library and its Marquee APIs are Goldman Sachs' and are not part of this work.
Why it matters
It is the market-risk counterpart to the MSCapital forecasting study: the same habit of judging a model only on data it had not seen, applied to the question a risk desk asks every day, and shipped as a tool someone else can install and use.